

If conversion and orders are both up, is there still a reason to investigate the product page?
While reviewing a set of mobile ecommerce figures, I found this contrast: for December 23–29, 2025, the overall visit-to-order conversion metric rose by about 19% and orders by about 14%, yet the product-to-cart step was still flagged as declining. Transaction value also fell by about 13% over the same period. More orders did not answer every question.
An overall recovery can hide a weaker step
Unique visitors were down by about 4% while orders were up by about 14%. If the conversion metric is calculated as orders divided by unique visitors, and both counts cover the same scope, these rounded changes give 1.14 ÷ 0.96 − 1 ≈ 18.75%, close to the recorded 19%. A larger numerator and a smaller denominator can explain the rise.
That 19% is a relative increase, not a gain of 19 percentage points. Nor is an order count the same as a count of unique purchasers. The calculation explains the overall ratio; it does not establish that adding a product to the cart became easier.

The difference could reflect changes in new versus returning customers, the product mix, or purchase paths. More orders through a “Buy now” route, for example, could bypass the cart. Changes to event tracking could also affect the step-level figures. Distinguishing these explanations requires following the same group of visitors rather than using the overall rate to judge an individual step.
First define a successful cart addition
I would start by defining which mobile product visitors and products to include, then checking product views, successful cart additions, and subsequent purchases. For a product-level question, follow the same product throughout. A visitor who views product A and adds product B has not completed A's add-to-cart step.
A button click is not necessarily a success. Missing options, unavailable stock, or a failed request can prevent an item from reaching the cart. Count the successful cart update and record failures separately. Keep user deduplication rules and the observation window fixed, too, so event counts, unique users, and orders do not get mixed together.
| Question | How to count it |
|---|---|
| Did product visitors successfully add to cart? | Unique users who successfully added a product ÷ eligible visitors to those products, within the same product scope |
| Did cart users go on to buy? | Users who subsequently bought the same product within the agreed window ÷ users who successfully added it |
| Did purchases bypass the cart? | Track “Buy now” and similar paths separately; observe orders for any product as a separate business outcome |
Before comparing periods, check for substantial changes in traffic sources, markets, customer mix, stock, and promotions. Then inspect products where the decline is concentrated. If the search-entry figures are not aligned yet, the GSC and backend traffic discrepancy review covers that earlier measurement problem.
With GA4, check that view_item, add_to_cart, and purchase fire for the intended business outcomes, using Google's ecommerce event documentation. Also distinguish item counts from user counts when reading reports: in the GA example below, Items purchased counts units, while Total purchasers counts people.
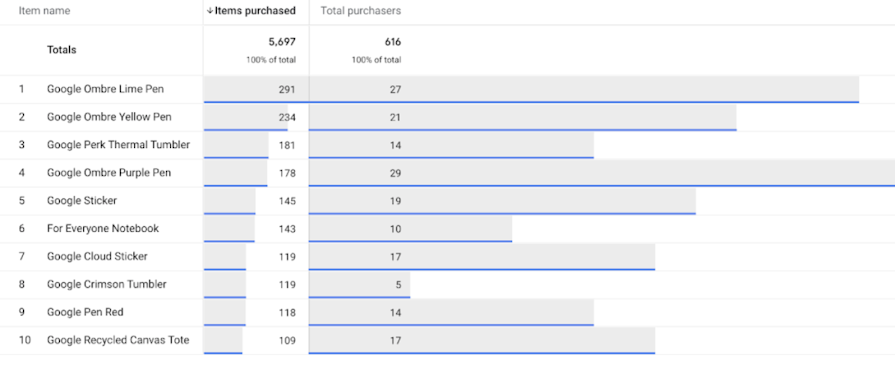
Keep funnel settings consistent: whether users may enter partway through, whether other actions can occur between steps, and how long users have to reach the next step. The original Chinese and English documentation below provides a reference for those settings. These are methods available today, not evidence that the historical backend used GA4.
Chinese original

English original

Turn “the page looks cluttered” into a question you can investigate
On the historical product page, promotional information appeared above the product options, some messages repeated, and the options were not prominent. That suggested a hypothesis worth checking: were users failing to choose an available variant because they could not find or understand the options?

Ask target users to complete a specific task: find an available variant of a given product, confirm its price and discount, and try adding it to the cart. Watch how long they spend finding options, which selections they miss or get wrong, and where the task fails. If they choose options easily but leave because of price, shipping, or stock, investigate those issues instead.
Baymard's size-selection research found that hiding sizes in dropdowns led some test participants to miss a selection or discover unavailable stock late. Its discount-presentation research also describes how repeated promotions and unclear placement can hinder price comprehension. These findings support an investigation; they do not establish that layout caused the decline in this case.
Move the options, then follow through to purchase
If the decline remains after checking the counts, and task observation shows that users struggle to find options, I would test one change: move the product options near the price, before the promotional information. Keep prices, promotion rules, stock, and shipping consistent. Test changes to title size or description layout separately.

Where a randomized experiment is feasible, assign eligible visitors to the original or test version, keeping each visitor's version stable. Compare the proportion who successfully add to cart, while monitoring subsequent purchases, orders, cancellations and refunds, and loading or option-selection errors. If cart additions rise without more purchases, check for wrong selections, misunderstood offers, or checkout failures.
Set the sample size, smallest change worth detecting, and observation period in advance. Do not declare success because two days look positive. If the planned endpoint leaves the result unresolved, record it as inconclusive. With little traffic, task observation can still help, but a few users' behavior or a simple before-and-after comparison is not a randomized experiment result.
If improvement appears only for certain products or users, continue testing within that scope first. Use the blank experiment log and instructions to preserve definitions, versions, and decision rules rather than changing the measurement basis next time.
This case supports further investigation of the add-to-cart step, not a full redesign yet. First check the counts, then test option placement, and finally assess whether the same group of users finds it easier to add to cart and complete a purchase.