
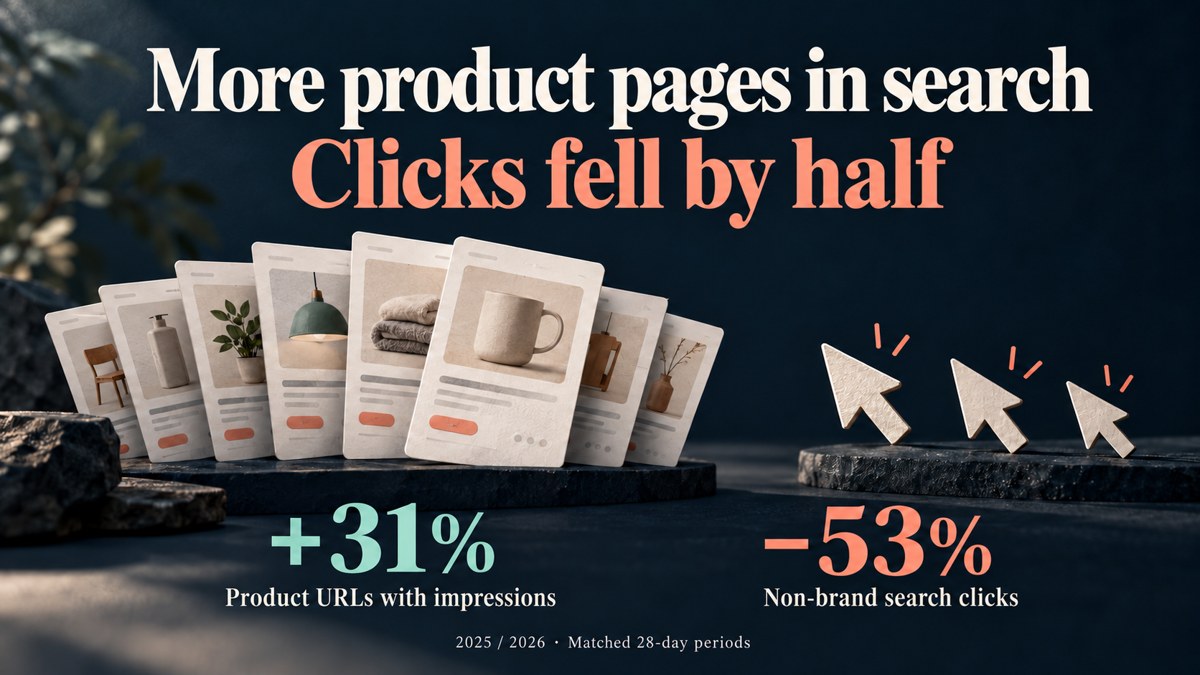
When I compared an ecommerce site's search performance ahead of Black Friday, two numbers were moving in opposite directions.
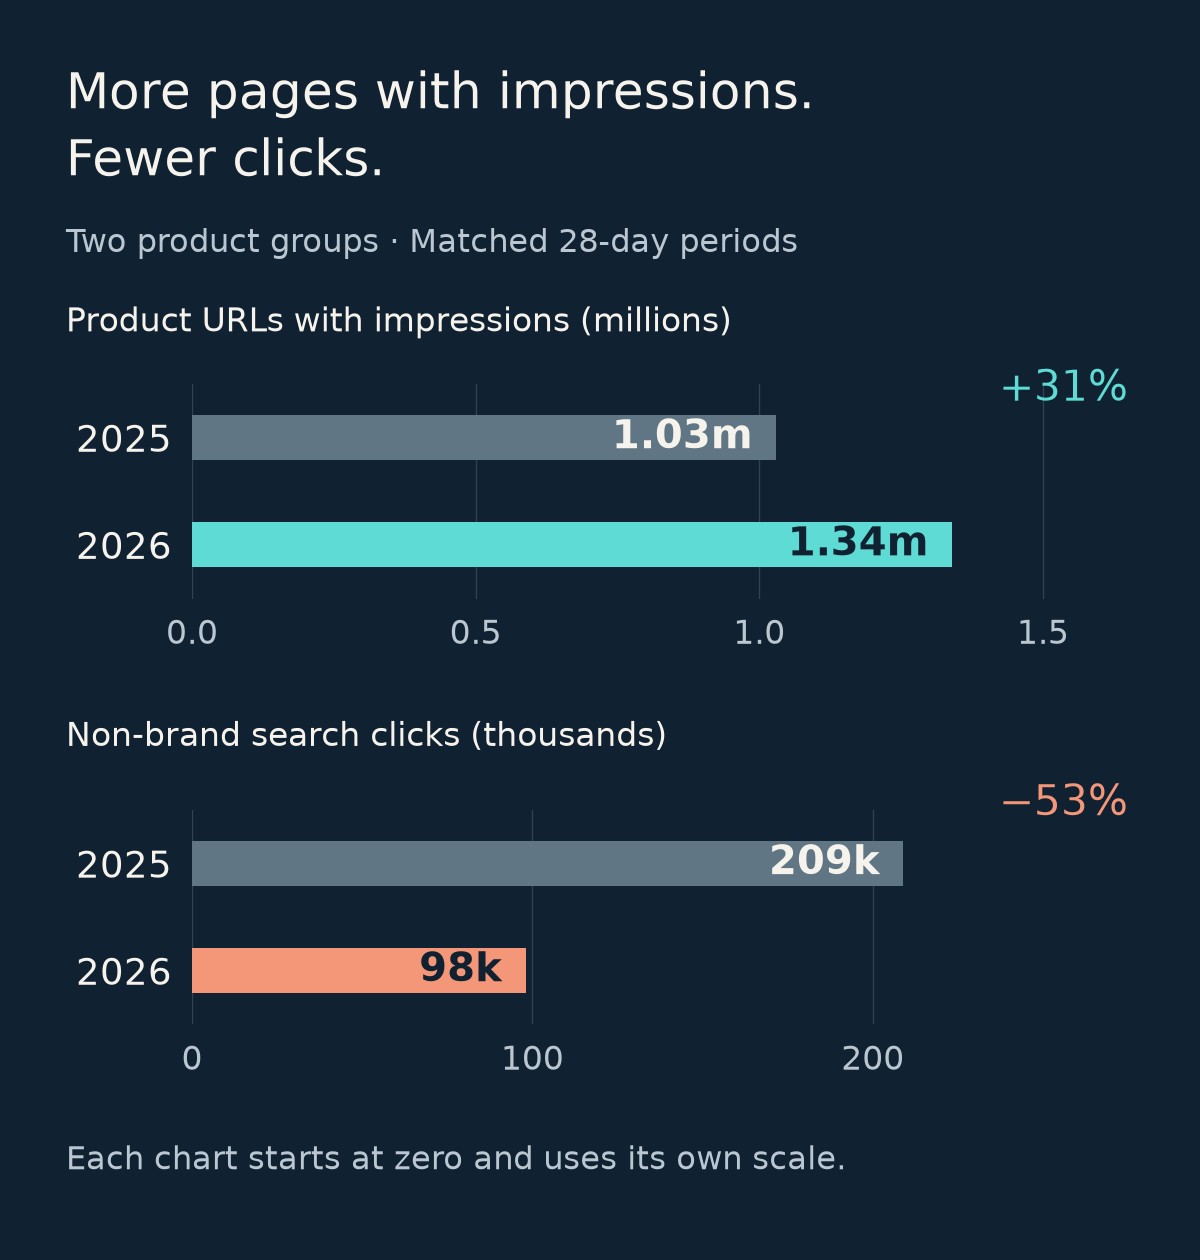
The number of product URLs with impressions had risen from about 1.03 million to 1.34 million, roughly 31% more than in the same period a year earlier. Taken on its own, that looked like a reason to keep expanding product coverage.
Over the same period, though, non-brand search clicks to the product pages fell from 209,000 to 98,000, a decline of 53%.
That was about 111,000 fewer clicks. It made me look again at what "with impressions" actually tells us. More pages had appeared in search, but fewer clicks had followed. Before adding more pages, I'd want to know what happened to the products that used to bring people in.
View the figures
| Metric | 2025 | 2026 | Change |
|---|---|---|---|
| Product URLs with impressions | About 1.03m | About 1.34m | +31% |
| Non-brand search clicks to product pages | 209,000 | 98,000 | −53% |
Both years cover September 7–October 4, a 28-day period, for the two product-page groups examined here. Clicks are from Google Search Console. "Product URLs with impressions" counts distinct URLs in those groups that recorded impressions during the period. Counts and percentage changes are rounded, so recalculating from the displayed values may produce a slightly different result.
More pages appeared at least once
A count of URLs with impressions answers a narrow question: did each page appear at all?
A product page with one impression during the period counts as one URL. So does a page with 10,000 impressions. More pages appearing occasionally can therefore push the count up. How often they appeared, where they appeared, and whether anyone clicked are separate questions.
The 31% increase does not mean product impressions rose 31%, let alone that rankings improved 31%. I don't have total product impressions for these two periods, so I can't tell whether impression volume grew alongside the URL count.
Nor can I calculate click-through rate by dividing 98,000 clicks by 1.34 million URLs. That denominator counts pages. As Google's search metric definitions explain, CTR divides clicks by impressions. Even an average of clicks per URL would first require matching the query filters and page scope of the two measures. Seeing the two figures side by side doesn't mean they were measured on the same basis.
The two trends can coexist. Many pages might be starting to pick up occasional impressions while a smaller number of previously productive pages lose substantial clicks. That's one possible explanation, not a finding about this site. To see whether it fits, I'd need to look at the individual pages.
I'd start with last year's pages
The move from 1.03 million to 1.34 million can look like one population getting bigger. But the two sets of pages might overlap a great deal, or very little.
If most of last year's pages still appear, alongside many pages with occasional impressions, I'd want to know whether the original pages held on to their clicks. If products that used to bring in clicks have left the range and their replacements aren't yet reaching the same demand, the rising page count and falling clicks could have a different explanation.
Those situations would lead me to different next steps.
So I wouldn't subtract 1.03 million from 1.34 million and call the result "310,000 new product pages." It is a net difference between two counts. Pages may have entered and left the observed sets. A URL appearing in search data for the first time may also belong to a product that has been on sale for a while.
I'd match the pages across the two periods, separating URLs with impressions in both years from those observed only this year or only last year. Then I'd check whether changed URLs represent the same product, different products, or a change in measurement scope. A URL missing from this year's data does not, by itself, establish that the product was removed or the page deindexed.
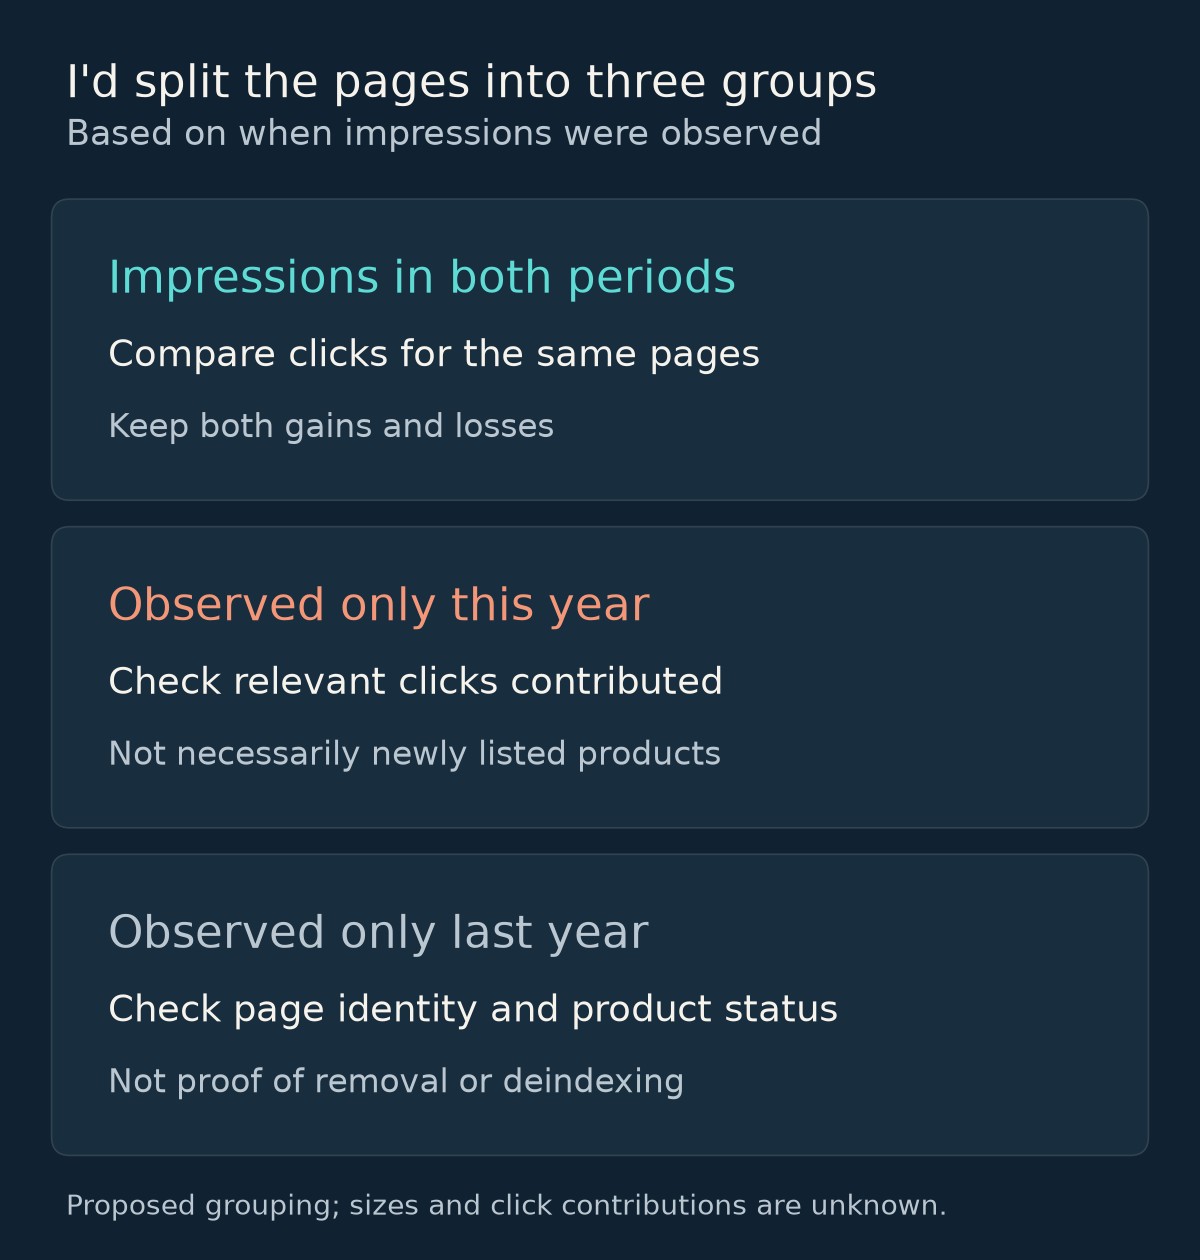
I'd be particularly interested in pages that brought in non-brand clicks last year, still have products available for sale, and now receive substantially fewer clicks. That is a more useful starting point for the business problem than the full population of pages that appeared at least once.
Starting the investigation with declining pages doesn't mean counting only declines. Existing pages may have gained or lost clicks. Pages observed only this year may have added clicks, while those observed only last year may previously have contributed a substantial amount. All those changes matter if I want to explain the net loss of roughly 111,000 clicks. If I couldn't match page identities or reconcile the measurement scopes, I'd leave those cases unresolved. Later, when examining queries, I wouldn't treat missing data as evidence of no demand.
Which losses I'd pursue before Black Friday
With limited time before Black Friday, I'd first look for concentrations of lost clicks among products that received clicks last year and remain on sale. I'd weigh the size of those losses alongside the products' commercial importance and whether relevant demand still exists. A once-popular product that no longer makes sense to sell wouldn't automatically move to the front of the queue just because it lost a lot of traffic.
I'd align the markets, devices and search types before examining demand. Fewer clicks for a product in one market could reflect less interest in it, or continued interest that the page is reaching less often. A decline in the site's impressions alone cannot separate those explanations. I'd look for evidence of how demand in that market has changed.
Google's guide to investigating search traffic drops also recommends comparing dimensions such as dates, pages, queries and countries. For this investigation, those comparisons need to answer a practical question: have people stopped looking for these products, or are they still looking without clicking through to these pages?
If impressions and positions for comparable queries were broadly stable but clicks had fallen, I'd look at what changed in the search results. Do the displayed titles, prices and product details fit what people want? Are other results meeting that need better? A lower CTR would give me a lead to investigate, not proof that rewriting titles would solve the problem.
If queries that previously brought in clicks now generated very few impressions, I'd first examine what had changed for those products and pages in search. Rewriting every product title at that point could leave the underlying problem untouched.
I'd examine the pages newly observed in search separately: which queries they reached, how many clicks they brought in, and whether those searches were relevant to the products. They may still be building a useful presence, or merely adding scattered impressions. Falling total clicks wouldn't make every one of those pages ineffective. A higher URL count wouldn't make the expansion a success, either.
If losses were concentrated among existing products with continuing demand, I'd investigate those opportunities first. If products had left the range and demand had changed, I'd reconsider what to cover. A 31% rise in URLs with impressions is worth a closer look. It isn't enough for me to decide to keep expanding.