
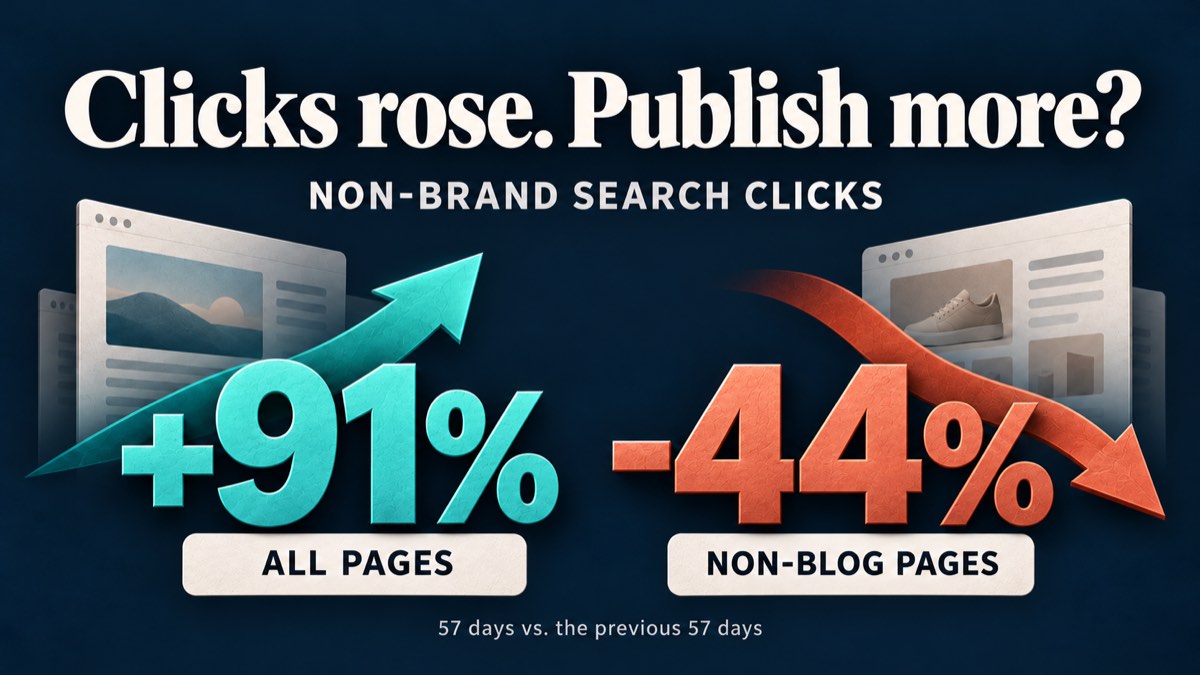
When I reviewed an ecommerce site's search performance around Black Friday 2025, two numbers stood out: total non-brand search clicks had risen about 91%, and blog clicks were nearly 25 times their previous level.
Then I separated the blog from the rest of the site. Clicks to the remaining pages had fallen 44%. Two groups of product pages were down 30% and 79%.
That contrast matters more to me than the headline growth. The blog was gaining clicks while product pages were losing them, and the combined total still looked healthy. But if the next investment is meant to help more potential buyers find products, I need to understand what those additional clicks actually accomplished.
First, I separate the sources of growth
I compared non-brand search clicks by page type across two periods. Each covered 57 days: October 5–November 30, 2025, and the period immediately before it.
| Page group | Earlier period | Black Friday period | Change |
|---|---|---|---|
| All pages | 678,000 | 1.30 million | +91% |
| Blog | 38,000 | 935,000 | About 25× |
| All pages except the blog | 641,000 | 361,000 | −44% |
| Product group A | 215,000 | 150,000 | −30% |
| Product group B | 276,000 | 59,000 | −79% |
| Category pages | 83,000 | 90,000 | +9% |
The Black Friday period is October 5–November 30, 2025; the earlier period is August 9–October 4, 2025. Each lasts 57 days. “Black Friday period” means the full comparison window, not just Black Friday week. The metric is non-brand web search clicks in Google Search Console. Counts and changes are rounded, so group totals differ slightly from the site total. Rows include both totals and subsets and must not be added together.
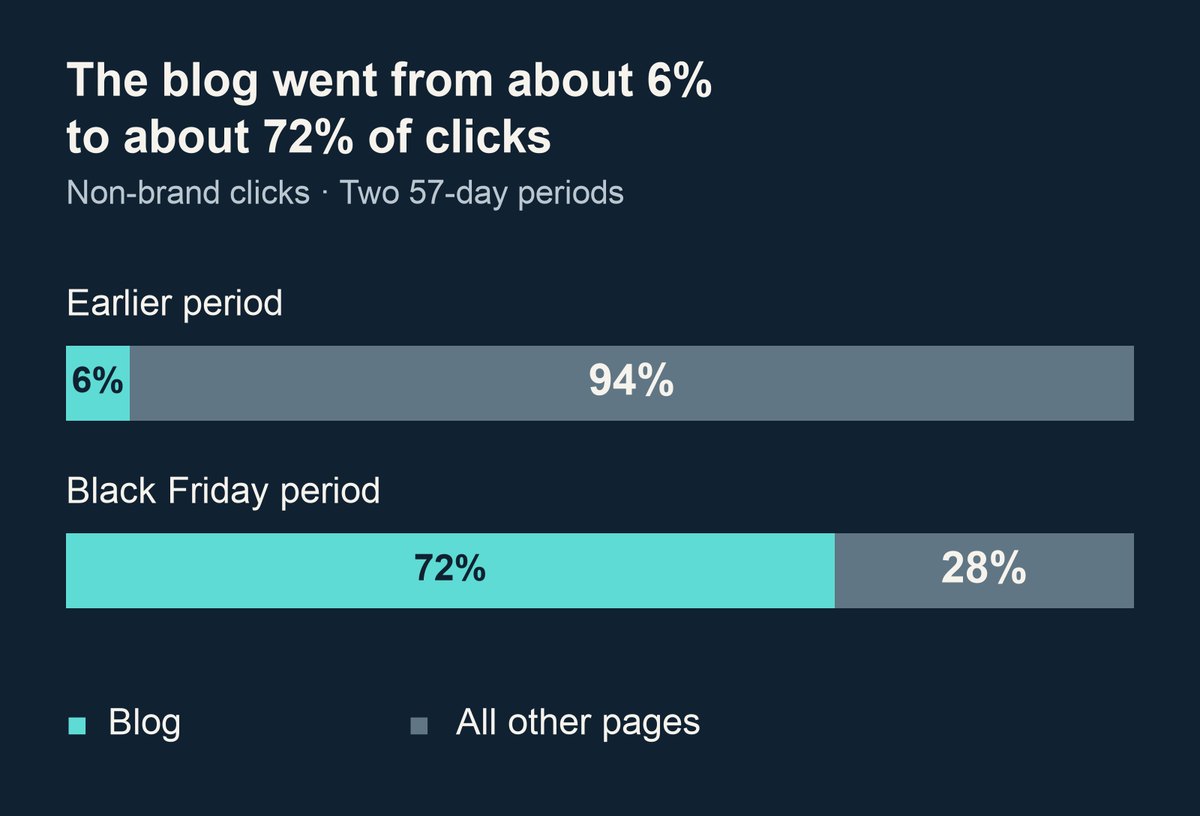
The shift is easier to see as a share of total clicks. Previously, about 6 out of every 100 clicks went to the blog. During the Black Friday period, that became about 72. The blog went from a small share of the site's non-brand search clicks to most of them.
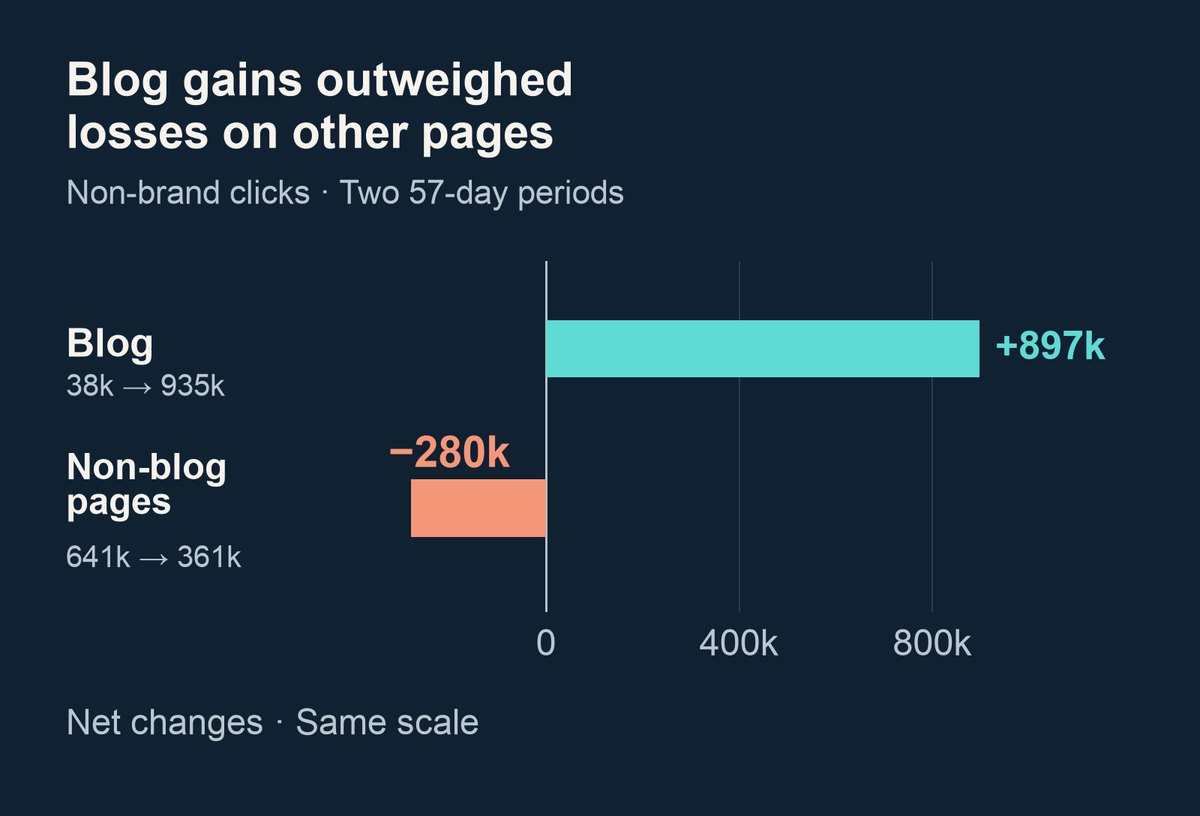
The blog added roughly 897,000 clicks, while the rest of the site lost about 280,000. The increase was large enough to keep the overall total rising. Looking only at that total, I could easily miss the loss of product-page traffic.
Those additional search clicks deserve a closer look. But I don't have orders, revenue or other business outcomes here, so I can't tell whether they made up for the lost product visits. To decide which content deserves continued investment, I would first look at the needs behind those searches and how they connect to the site's products.
Why gift-card balance searches caught my attention
One of the blog's traffic-generating topics was checking gift-card balances at other retailers. It contains the word “gift” and appears around Black Friday, so it's easy to associate it with holiday shopping.
I would separate two very different searches: checking how much money is left on a card, and choosing a gift for your father. The first is about a particular card and retailer. The second is about deciding what to buy. Both kinds of article may attract clicks, but that doesn't establish that they create similar demand for this ecommerce site's products.
So before asking whether a balance-checking article could attract more traffic, I would ask what happens next. Once someone has checked their balance, why would they browse products here? If that connection is unclear, adding a product link at the bottom of the article won't, by itself, make the traffic useful for acquiring customers.
Other growing topics included entertainment, benefit payments and help with streaming services. I wouldn't dismiss them solely because of their topic labels. But before investing more, I need to know how they relate to the site's goals.
For content that helps people choose, use or maintain products, I would examine subsequent product browsing and purchases using on-site data. Search clicks and those on-site actions need separate measurement; Google's guide to Search Console and Analytics data explains the distinction. Content intended to reach a relevant audience or support existing customers should be evaluated against those agreed goals. The goal needs to be clear before publication, rather than invented after clicks rise to give every topic a reason to count as a success.
I also looked beyond Black Friday. Weekly blog clicks fell from a peak of roughly 226,000 to about 5,000 at the January 12, 2026 observation point. Before using that peak to plan year-round content expansion, I need to understand how much demand remains after the season ends.
That doesn't mean seasonal content failed simply because traffic fell afterward. Some content is useful for a limited period. If the results during that period justify the cost, it can still be worth producing again.
My recommendation is to pause plans to scale up production around the topics that drove the peak. The blog's downstream results still need checking. The product-page decline can be investigated now.
I'd start the product-page investigation with group B
Group A lost about 65,000 clicks net; group B lost about 217,000. Group B accounted for roughly 77% of the two groups' combined net decline. To explain this historical loss, I would start there because it covers a larger share of the missing clicks. How to allocate repair work would still depend on the products involved, their commercial value and the cost of fixing the underlying problems.
I also noticed that category-page clicks grew 9%. I wouldn't describe this as a decline across every type of commercial page. But category and product pages may serve different queries and product ranges, so their diverging performance doesn't establish that one template works better.
Next, I compared weekly clicks to the two product groups with the previous year. At the early-October observation point, their combined clicks were 31,900 in 2025, ahead of 29,000 in 2024. By Black Friday week, 2025 had only 23,200 clicks against 40,600 a year earlier, a decline of about 43%.
This comparison uses the two product groups' combined weekly clicks, separately from the 57-day comparison above. Black Friday week began on November 24 in 2025 and November 25 in 2024. The exact week-start dates for the early-October observations are unavailable.
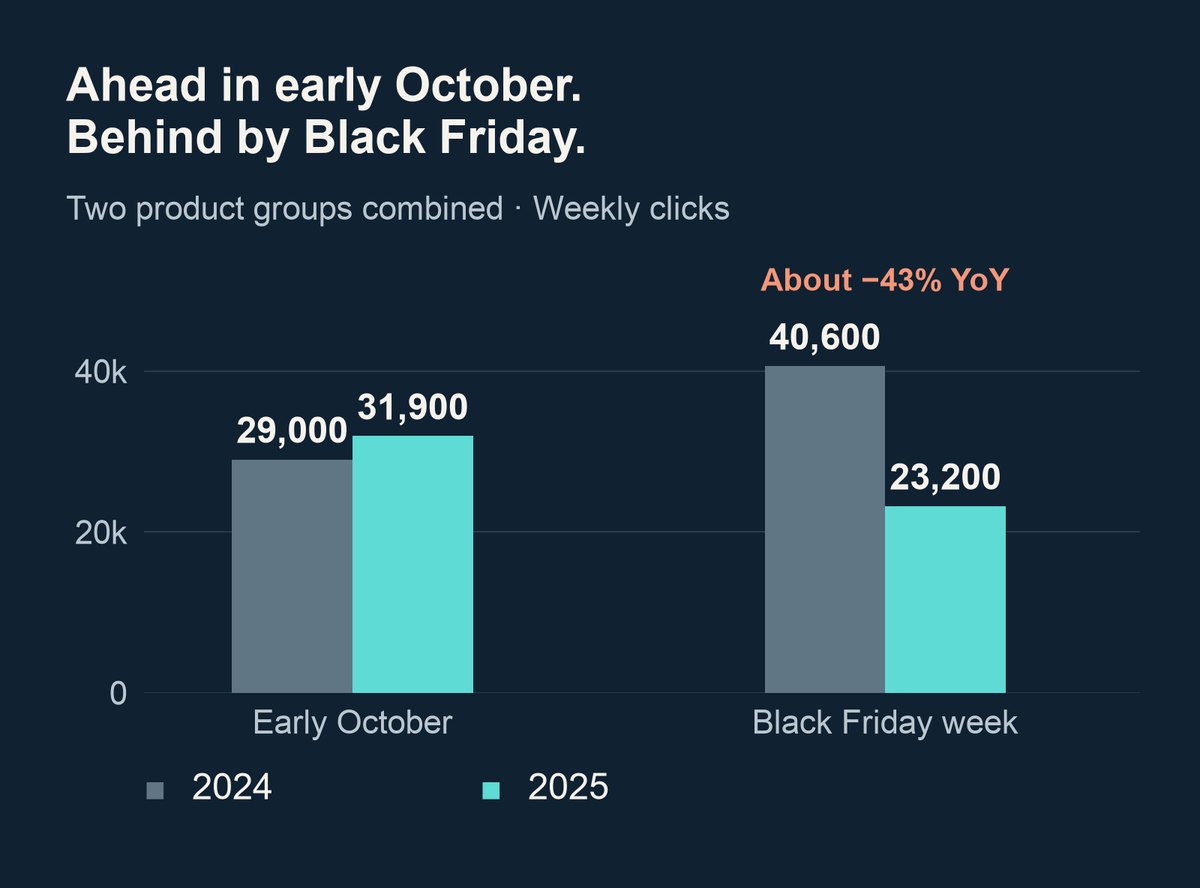
At least at that early-October observation point, 2025 wasn't behind. By Black Friday, the gap was substantial. That gives me a reason to investigate why the product pages fell behind, rather than letting the rising site total distract me.
Seeing group B lose about 217,000 clicks wouldn't make me start rewriting product copy. I would begin with the pages that lost the most clicks and check whether the products still exist, their URLs have moved or their group assignments have changed. A page missing from search data isn't proof that it was deleted; I would need the product inventory and migration records to establish what happened to it.
To reconcile the total, I would use complete page lists for both periods. The calculation must include gains and losses on continuing pages, pages entering the group, and confirmed departures or migrations. Products whose identities can't be matched should remain in a separate unknown category. Adding up only declining pages would omit the gains that offset some losses and wouldn't reconcile to the net decline of about 217,000 clicks.
If clicks lost from old URLs turn up on their replacement URLs, I would first correct the mapping between old and new addresses in the analysis. Changing the migration setup would require evidence of a specific fault. A decline at an old URL is not enough to show that a migration failed.
If most losses come from products confirmed as discontinued with no replacements, the first discussion should be about how the site will serve the demand those products previously met. Adding copy to old pages may do little to solve a product-availability problem.
If the products and URLs are correctly matched and continuing pages still show a substantial decline, I would then examine query demand and search visibility in the same historical market and device segments. Any gaps that can't be matched at query level should stay visible for further investigation, rather than being assigned a convenient explanation.
I don't yet know which of those situations applies to group B. These are the next steps I would take to find out.
I would run the product-page investigation alongside the blog evaluation. For product pages, the immediate questions are where losses are concentrated and how much we can explain. For the blog, the question is what happened after people arrived through the main growth topics. Those answers would inform what to fix and what to keep publishing.
This review concerns Black Friday 2025. For a new round of investment, I would repeat the analysis with current, comparable data instead of carrying forward last year's group B priority or blog peak. Before using last year's results to justify the next budget, I want to be able to explain which content achieved its goal and why it deserves more investment.