A practical framework for AI visibility dashboard metrics, including prompt coverage, mention rate, citation share, sentiment, answer accuracy, and conversion.
An AI visibility dashboard should not be a single score. GEO teams need a small set of metrics that explain where a brand appears, which prompts trigger it, which sources are cited, how the brand is described, whether the answer is accurate, and whether any AI-influenced traffic turns into business outcomes.
Last updated: 2026-06-19
Key Takeaways
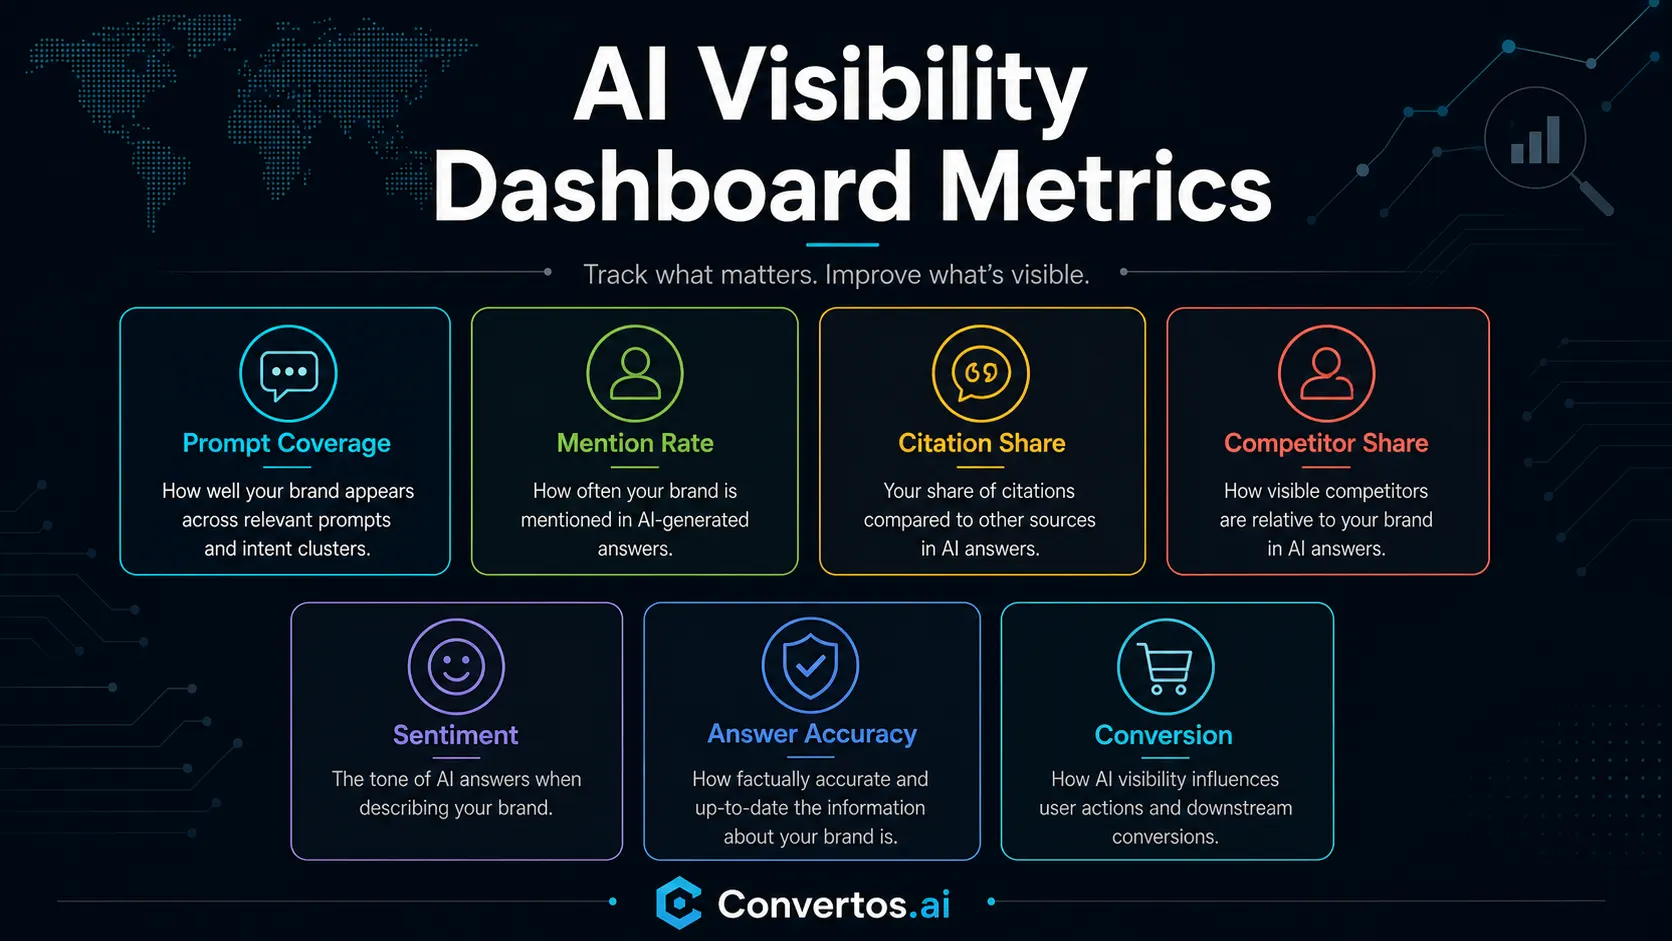
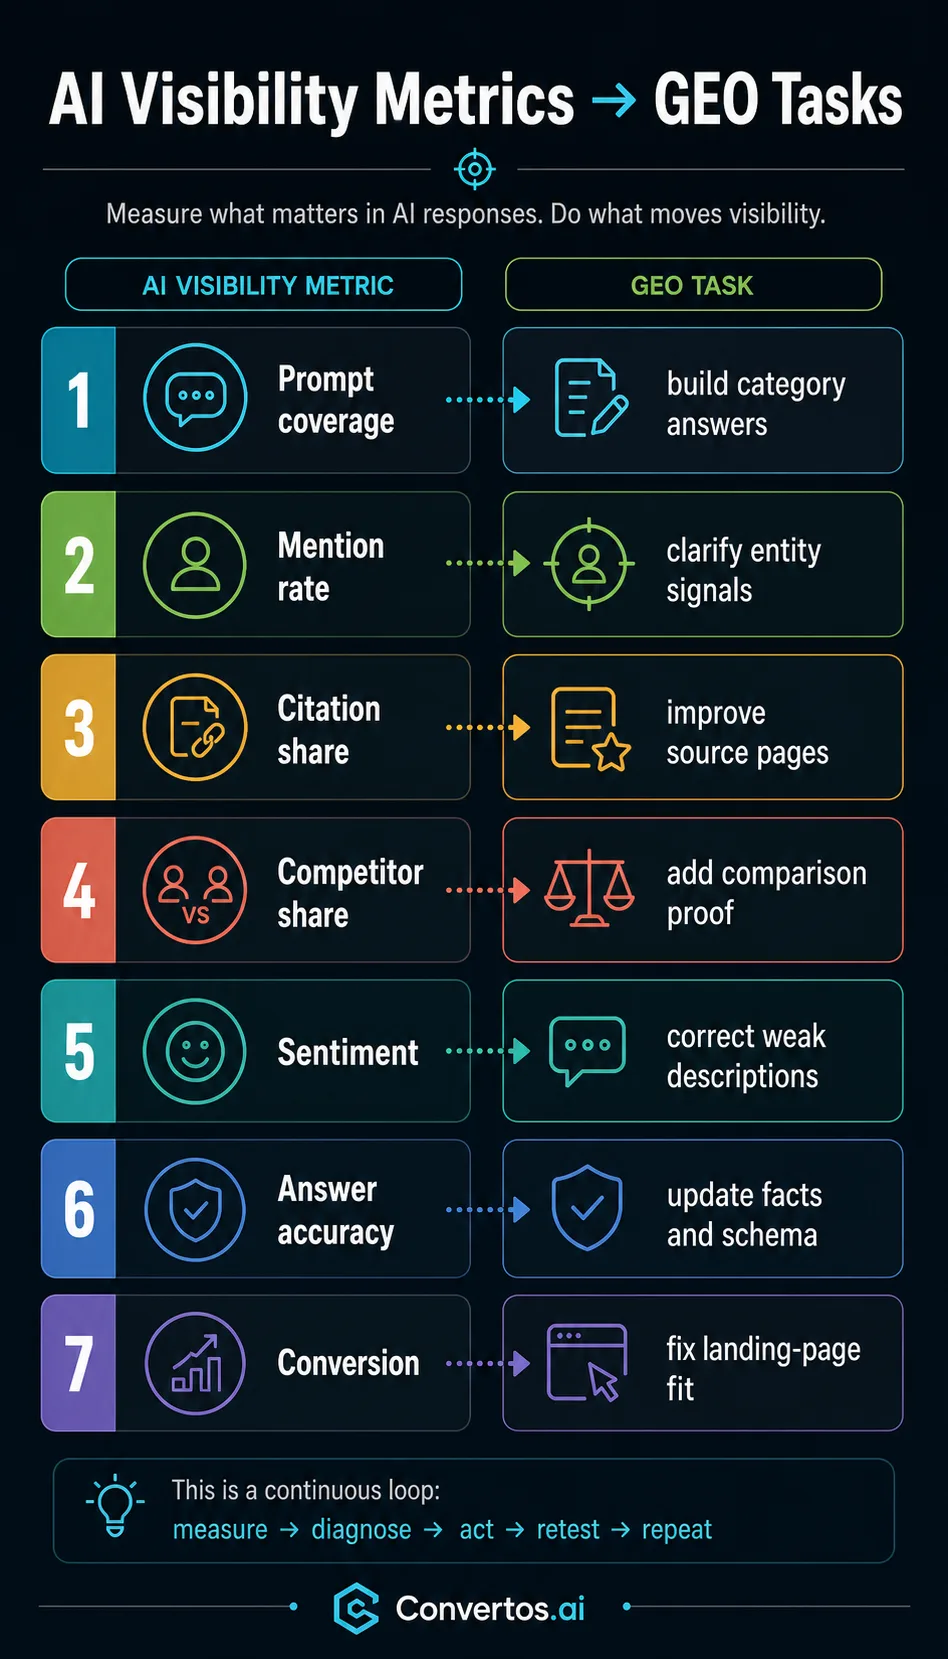
The core AI visibility metrics are prompt coverage, mention rate, citation share, competitor share of voice, sentiment, answer accuracy, and AI referral conversion.
A dashboard is weak if it only says "visible" or "not visible." It should show which prompt, platform, source, and page caused the result.
GEO reporting should separate leading indicators, such as citations and sentiment, from lagging indicators, such as pipeline and revenue.
The best dashboard turns metrics into tasks: page fixes, source improvements, factual corrections, and retesting.
A good AI visibility dashboard explains what to fix, not just whether the brand appeared.
What An AI Visibility Dashboard Should Answer
AI visibility monitoring is becoming its own reporting category. Amplitude's AI visibility monitoring guide describes tools that measure brand presence across AI platforms and connect it to outcomes. Clay's AI visibility dashboard guide frames dashboards around whether ChatGPT, Claude, and Perplexity name a brand, plus citation rate, sentiment, and share of voice. AirOps' AI visibility metrics article highlights citation share, competitive share of voice, mention rate, sentiment, and drift.
Those sources point to the same practical requirement: a dashboard should answer five questions.
Dashboard question
Why it matters
Where do we appear?
Shows platform and prompt coverage
Why do we appear?
Reveals cited sources and answer triggers
Who appears instead?
Shows competitor share of voice
How are we described?
Detects sentiment, factual errors, and positioning drift
What should we do next?
Turns reporting into page, source, or content tasks
If a dashboard cannot answer the last question, it is a reporting artifact, not a GEO operating system.
The Core Metrics
Start with these metrics before adding complex scoring.
Metric
Definition
Action if weak
Prompt coverage
Share of tracked prompts where the brand appears
Add category, comparison, alternative, and FAQ content
Mention rate
Frequency of brand mentions across platforms
Improve entity clarity, third-party mentions, and topical authority
Citation share
Share of answers citing owned or preferred sources
Improve source-worthy pages and external citation coverage
Competitor share of voice
How often competitors appear in the same prompts
Add comparison evidence and positioning language
Sentiment
Whether the answer frames the brand positively, neutrally, negatively, or inaccurately
Publish correction-ready facts, docs, and rebuttal content
Answer accuracy
Whether facts, features, pricing, and use cases are correct
Update product pages, schema, FAQs, and help docs
AI referral conversion
Whether AI-originated visits engage or convert
Improve landing-page clarity, proof, CTAs, and routing
Do not average these into one score too early. A brand can have high mention rate and low citation share. It can have strong citations and poor sentiment. Each metric points to a different fix.
Each dashboard metric should map to a page, source, or measurement action.
Metric Formulas And Common Misreads
Before a dashboard becomes a leadership report, define each formula. A simple formula prevents month-to-month arguments about whether a metric changed or the denominator changed.
Metric
Simple formula
Common misread
Prompt coverage
Prompts with brand mention / tracked prompts
Treating all prompts as equally valuable
Citation share
Answers citing target URLs / answers with citations
Ignoring whether the cited page is accurate or current
Competitor share
Competitor mentions / tracked prompts
Averaging all competitors into one vague benchmark
Counting confident but outdated answers as success
Similarweb's AI Brand Visibility framing is useful because it keeps prompts, citations, competitors, topics, and sentiment separate. Conductor's AI mention and citation tracking material makes the same operational point: mentions and citations need to be tracked together, not as one blended signal.
Leading, Middle, And Lagging Indicators
Traditional SEO reporting often starts with rankings, impressions, clicks, and sessions. GEO reporting needs those, but it also needs pre-click signals. AI answers can shape a buyer's shortlist before a website visit happens.
Split the dashboard into three layers:
Prove whether AI visibility is commercially useful
Search Influence's AI search KPI guide makes a similar point: traditional metrics alone do not capture AI search performance. The dashboard should connect visibility to user behavior without pretending every AI influence creates a clean referral.
Platform And Prompt Segmentation
Never show one undifferentiated AI visibility number. Segment by platform and prompt type.
Platform segmentation should include ChatGPT, Gemini, Perplexity, Google AI surfaces, and any vertical assistant that matters in the market. Prompt segmentation should include discovery, comparison, alternative, pricing, risk, integration, and "best for" prompts.
This segmentation prevents bad decisions. A brand might perform well in ChatGPT discovery prompts but be absent from Gemini comparison prompts. Another brand might be cited by Perplexity but misdescribed by ChatGPT. A single score would hide both problems. Use the ChatGPT vs Gemini GEO strategy workflow to decide which platform gaps deserve a separate fix.
For a first baseline, run an AI visibility snapshot. For page-level diagnosis, pair the dashboard with a URL review and citation check.
Turning Metrics Into Tasks
The dashboard should produce an action queue. For example:
Dashboard signal
Likely diagnosis
Task
Brand missing from category prompts
Weak topical association
Build or rewrite category and solution pages
Competitor appears with stronger explanation
Competitor positioning is clearer
Add comparison sections, proof, and fit language
AI cites outdated third-party source
Source layer is stale
Update owned pages and pursue correction or better third-party coverage
Sentiment is negative or inaccurate
AI is repeating old facts or weak reviews
Publish factual correction pages, FAQs, and docs
AI referrals land but do not convert
Landing page does not match AI-influenced intent
Improve headline, proof, CTA, and next-step routing
This is where dashboards become useful. The metric is not the work. The work is the fix that follows.
Dashboard Cadence
Run high-value prompts weekly when a market is moving quickly. Run larger category prompt sets monthly. Review source and sentiment changes after content updates, launches, pricing changes, and major platform releases. For leadership reporting, show a monthly scorecard with only the metrics that changed decisions.
A practical cadence:
Weekly: top prompts, mention rate, citation changes, major inaccuracies.
Monthly: full prompt set, platform comparison, competitor share of voice, sentiment trends.
This cadence keeps the dashboard alive without turning it into noise.
Short explainer: the AI visibility metrics that should appear in a GEO dashboard.
Video transcript summary: AI visibility dashboards should track prompt coverage, mentions, citations, competitor share, sentiment, answer accuracy, and conversion. The dashboard should separate leading and lagging indicators and turn each signal into a specific GEO task.
FAQ
What is an AI visibility dashboard?
It is a reporting system that tracks how a brand appears across AI answer systems such as ChatGPT, Gemini, Perplexity, and Google AI surfaces. It should measure prompts, mentions, citations, sentiment, accuracy, competitors, and downstream outcomes.
Source signal: Amplitude, Clay, AirOps, and AI visibility SERP research.
What is the most important AI visibility metric?
There is no single metric. Prompt coverage, mention rate, citation share, sentiment, and answer accuracy each diagnose a different problem. Citation share is often the most actionable because it points to the sources shaping the answer.
Source signal: AirOps AI visibility metrics and Clay AI dashboard guidance.
Should GEO teams track AI referral traffic?
Yes, but not alone. AI referral traffic is useful because it connects to real visits, but it misses non-click influence. Pair it with prompt visibility, citation share, sentiment, and conversion data.
Source signal: Search Influence AI KPI guidance and Convertos GEO workflow.
How often should AI visibility be checked?
High-value prompts can be checked weekly. Larger category prompt sets usually work monthly. Retest after major content changes, product changes, pricing changes, or platform updates.
Source signal: AI visibility tool SERP patterns and Convertos prompt monitoring workflow.
What should a dashboard do after it finds a gap?
It should identify the prompt, platform, cited source, competitor, sentiment issue, and target page. Then the team can decide whether to fix content, improve sources, correct facts, add schema, or retest.
Source signal: Similarweb AI Brand Visibility structure and Convertos page-level review workflow.
Source Statement
This article is based on AI visibility dashboard and metrics guidance from Amplitude, Clay, AirOps, Search Influence, Similarweb AI Brand Visibility materials, SERP research reviewed on 2026-06-19, and Convertos.ai GEO workflow experience. Dashboard vendors define metrics differently, so teams should document formulas, platform coverage, prompt sets, and data refresh cadence before comparing numbers.